
In today’s rapidly evolving software landscape, traditional admin dashboards—filled with static charts, isolated data tables, and passive monitoring widgets—are quickly becoming obsolete. Modern enterprise users no longer want to just see raw data; they want actionable intelligence, automated workflows, and proactive decision support directly embedded within their applications. Transforming a standard web or mobile application into an AI-powered software product is no longer a luxury—it is a core competitive necessity.
In this deep-dive guide, we explore how to modernize a classic admin dashboard framework—specifically using Ademin by FlutKit as our architectural case study—by transforming passive UI components into an intelligent, proactive ecosystem. We will cover the design philosophy, architectural components, user interface patterns, and step-by-step implementation breakdown for integrating:
- Embedded Business Insight Cards with diagnostic analysis and dynamic confidence metrics.
- Contextual Recommended Action Cards enabling one-click automated task execution.
- The Core Engine: The AI Operator Flyout Panel, an intelligent assistant triggered by a Floating Action Button (FAB), supporting full-screen maximization, multi-tab task management (Chat, Insights, Actions, Agents, Logs, and Settings), and autonomous background operations.
1. The Paradigm Shift: From Passive Dashboards to AI-Powered Applications
For the past two decades, Business Intelligence (BI) and administrative dashboards operated under a single visual paradigm: Fetch, Aggregate, Display.
When a user logged into a traditional admin template, they were greeted by KPI cards (e.g., Total Revenue, Monthly Active Users, Bounce Rate) and data charts. While these visuals provided high-level visibility, they placed 100% of the cognitive burden on the human operator:
- Human Data Interpretation: The user had to analyze why a metric dropped or spiked.
- Manual Root-Cause Analysis: The user had to navigate across multiple sub-menus (Logs, Payment Gateways, Cart Analytics) to diagnose the issue.
- Manual Execution: The user had to manually perform corrective actions in third-party systems (sending marketing emails, reconfiguring gateway timeouts, contacting developers).
Traditional Dashboard Flow:
[ Static Raw Data ] ---> [ Human Manual Analysis ] ---> [ Manual Navigation & Action ]

AI-Powered Application Flow:
[ Automated Anomaly Detection ] ---> [ Root-Cause Explanation ] ---> [ One-Click / Autonomous Action ]
An AI-Powered Application shifts the workflow from reactive monitoring to proactive co-piloting and autonomous execution. It answers three essential questions automatically:
- What happened? (Observation)
- Why did it happen? (Diagnosis & Confidence Scoring)
- What should we do right now? (Actionable Recommendation & Execution)
2. Case Study Overview: Ademin by FlutKit
To demonstrate how to build an AI-powered interface, we utilize Ademin by FlutKit—a modern, clean admin template designed for e-commerce, CRM, SaaS, and enterprise applications.
By upgrading Ademin from a static admin template to an AI-Native Operating Environment, we introduce three primary visual and functional layers based on the screenshots provided:
- Surface Level (In-Dashboard Analytics): Highlighting anomalies directly on the main dashboard view via Business Insight Cards paired with Recommended Action Cards.
- Interactive Layer (AI Operator Flyout): A universal side-drawer interface triggered via a Floating Action Button (FAB) that houses chat, full telemetry logs, active agent management, and task progress monitoring.
- Background Layer (Autonomous Agents): Specialized sub-agents running asynchronous background jobs that continuously evaluate metrics, trigger alerts, and run scheduled operational tasks.
3. Component 1: In-Context Business Insight Cards
Instead of requiring users to open a separate analytics tool to find revenue leaks, an AI-powered dashboard brings diagnostic findings directly into the user’s immediate line of sight.
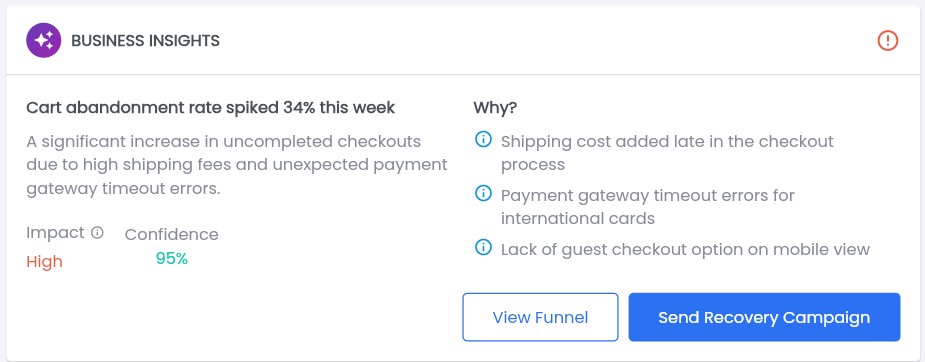
Key UI & Functional Elements of the Business Insight Card
- Header & Context Badge: Features an AI sparkle icon with a clear visual hierarchy and an urgency alert badge (
!). - Impact & Root-Cause Headline: Bold, plain-language diagnostic messaging (“Cart abandonment rate spiked 34% this week”).
- Generative Explanation Paragraph: Summarizes underlying friction points gathered from multi-source data ingestion (e.g., shipping costs added late, payment gateway errors).
- Impact & Confidence Metrics:
- Impact Level: Visual badge (
High,Medium,Low) helping users prioritize critical issues. - AI Confidence Score: Explicit probability score (
95%), building trust by showing how sure the machine learning model is of its diagnostic conclusion.
- Impact Level: Visual badge (
- Categorized Root-Cause Breakdown (“Why?”): Bulleted diagnostic points highlighting exact system or user friction points:
- Shipping cost added late in the checkout process
- Payment gateway timeout errors for international cards
- Lack of guest checkout option on mobile view
- Direct Contextual Action Buttons: Secondary (
View Funnel) and Primary (Send Recovery Campaign) call-to-actions allow immediate remediation without leaving the view.
4. Component 2: Contextual Recommended Action Cards
Directly adjacent to diagnostic insights sits the Recommended Actions Card. This widget bridges the gap between insight generation and execution.
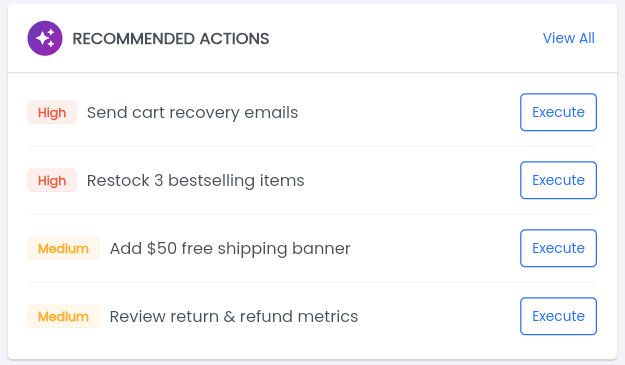
UI Features & Autonomous Functionality
- Priority Badging: Color-coded priority tags (
High,Medium,Low) based on expected business impact and revenue recovery potential. - Clear Task Description: Plain-language actions generated by the AI (e.g., “Send cart recovery emails”, “Restock 3 bestselling items”).
- One-Click Execution (
ExecuteButton): Instead of forcing the admin to navigate to marketing automation or inventory management pages, clickingExecutetriggers an automated background task or agent workflow. - “View All” Modal Navigation: Expands into the full AI Operator Flyout under the Actions tab for detailed task tracking.
5. Component 3: The AI Operator Flyout Architectural Deep-Dive
The centerpiece of transforming Ademin by FlutKit into an AI-powered application is the AI Operator Flyout Panel.
5.1 Trigger & Layout Dynamics (FAB & Maximize Mode)
- Floating Action Button (FAB) Trigger: Positioned persistently in the workspace layout, a branded sparkle button allows users to toggle the AI Operator flyout from anywhere within the dashboard.
- Slide-over Drawer Design: Opens smoothly as a right-hand flyout panel overlaying the dashboard content while maintaining background context.
- Maximized (Full-Width) View: A dedicated maximize button (
[ [] ]) in the header allows the user to expand the side drawer into a full-width workspace mode when reviewing complex logs, multi-agent status matrices, or performing deep-dive conversational analysis. - Tabbed Interface Architecture: Organized into 6 distinct tabs to maintain clean visual segmentation between conversational assistance, proactive monitoring, background task tracking, agent fleet orchestration, system logs, and system preferences.
5.2 Tab 1: Interactive Chat & Diagnostic Shortcuts
The Chat tab serves as the primary conversational interface between the operator and the underlying Large Language Model (LLM) ecosystem.
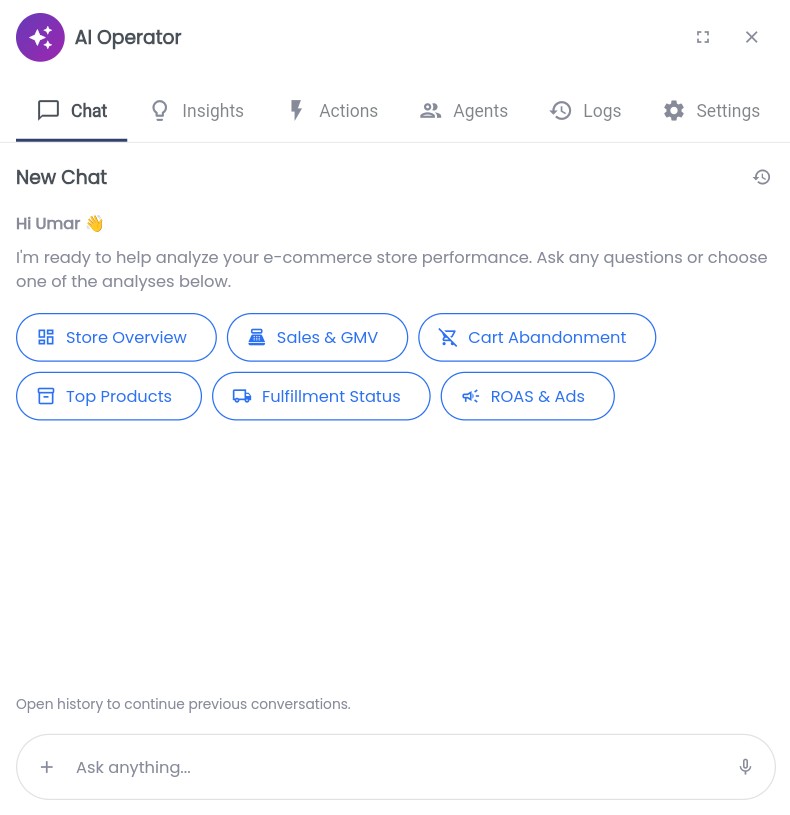
Key Capabilities & Features
- Personalized Onboarding & Context Awareness: Recognizes the active logged-in user (“Hi Umar 👋”) and sets clear operational expectations.
- Prompt Chip Shortcuts: Provides instant one-click analysis queries for common operational needs:
Store Overview: Generates high-level executive summaries.Sales & GMV: Deep-dives into Gross Merchandise Value trends.Cart Abandonment: Launches immediate funnel drop-off diagnostics.Top Products: Analyzes product margin and inventory performance.Fulfillment Status: Audits warehouse and delivery delays.ROAS & Ads: Evaluates paid marketing spend efficiency across channels (Meta, Google Shopping).
- Conversational Memory & History: Seamlessly stores and retrieves past conversation sessions (
Open history to continue previous conversations). - Multimodal Input Field: Features a clean query box (
+ Ask anything...) with voice-to-text integration microphone support.
5.3 Tab 2: Categorized Insights & Risk Severity Filters
The Insights tab provides an aggregated feed of all proactive system detections across the entire organization.
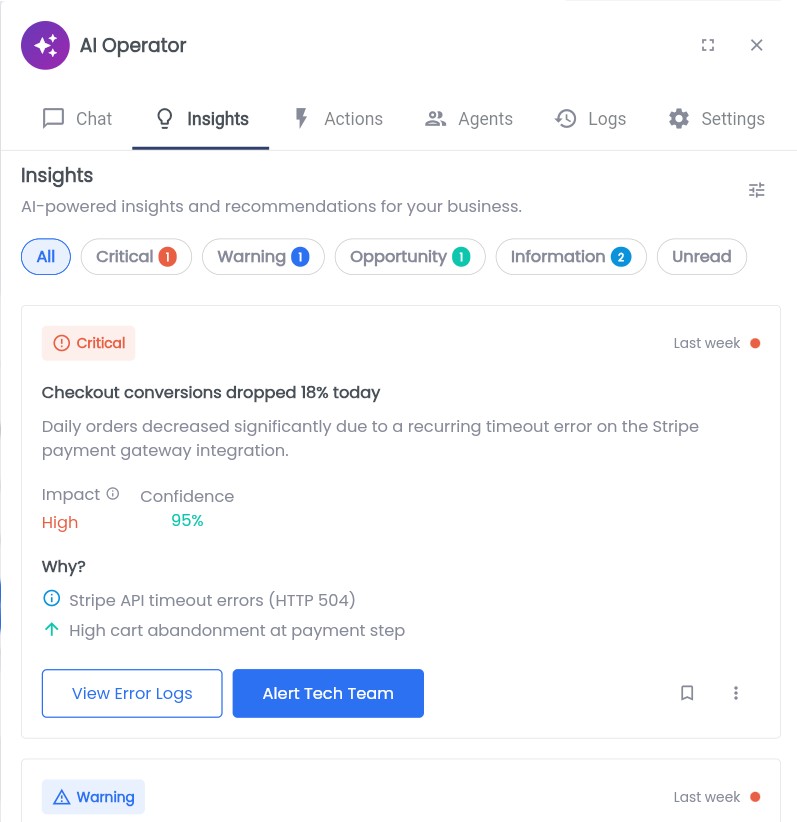
Key Capabilities & Features
- Severity Filter Chips: Allows filtering notifications by severity levels:
Critical: Severe issues causing immediate revenue loss or platform outage (e.g., Stripe payment HTTP 504 gateway timeouts).Warning: High-value cart abandonments ($100+ value) or shipping friction.Opportunity: Uncapped marketing campaigns with high ROAS.Information: System sync updates and summary notifications.Unread: Quick toggle to process unreviewed alerts.
- Deep Technical Telemetry Breakdown:
- Displays explicit diagnostic root causes (e.g.,
Stripe API timeout errors (HTTP 504)). - Evaluates both financial Impact (
High) and statistical Confidence (95%).
- Displays explicit diagnostic root causes (e.g.,
- Direct Operational Controls: Embedded actionable buttons such as
View Error LogsandAlert Tech Team, plus bookmarking and overflow options.
5.4 Tab 3: Real-Time Action Task Tracker & Execution Status
When actions are executed from dashboard cards or conversational prompts, they are tracked in real-time under the Actions tab.
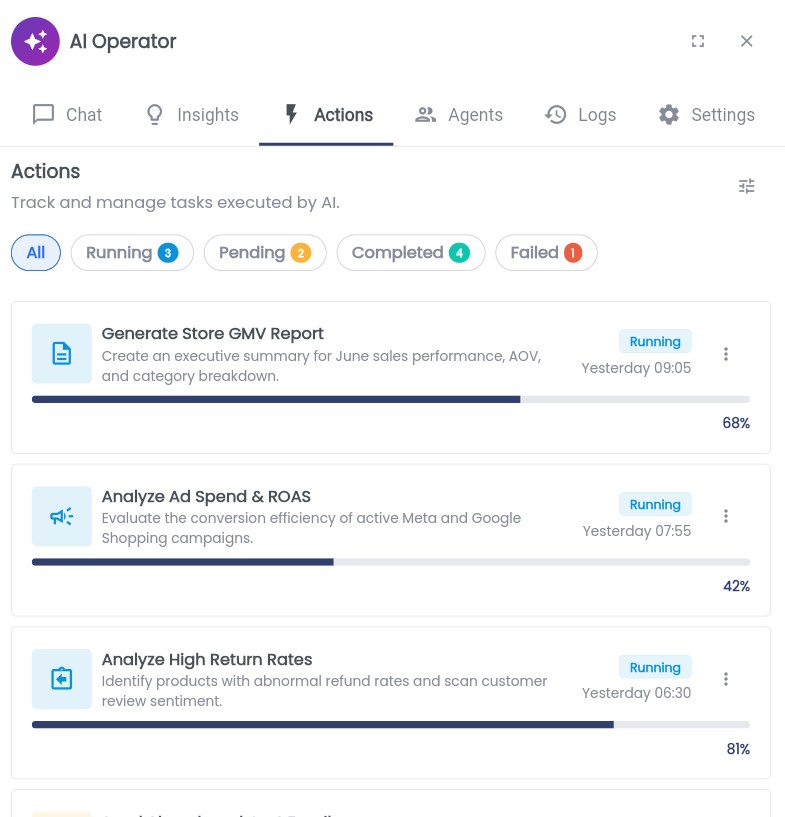
Key Capabilities & Features
- Lifecycle Filter Statuses: Segmented into
Running,Pending,Completed, andFailedjobs. - Granular Execution Progress Bars: Real-time percentage completion metrics (e.g.,
68%,42%,81%) powered by backend web sockets or polling endpoints. - Task Metadata: Displays human-readable descriptions, execution timestamps (
Yesterday 09:05), and iconographic classification (Reports, Ads, Returns).
5.5 Tab 4: Autonomous AI Agents Management
Modern AI applications move beyond simple prompt-response interactions by utilizing specialized Autonomous AI Agents. The Agents tab serves as the command center for monitoring and deploying these background workers.
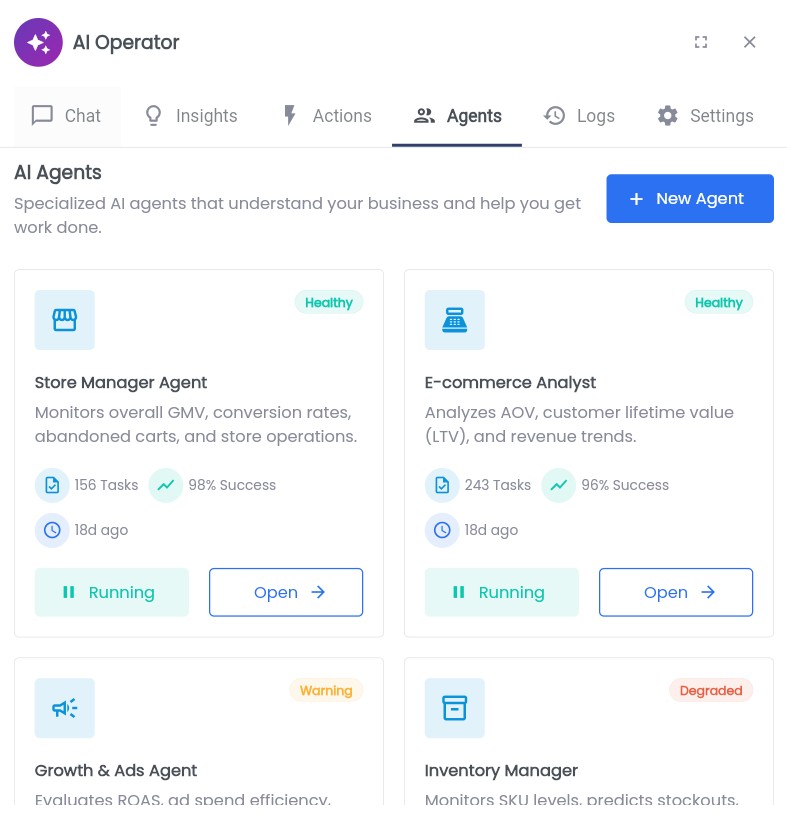
Specialized Agent Profiles Displayed
- Store Manager Agent:
- Role: Overall platform health, GMV monitoring, abandoned carts, and routine order fulfillment operations.
- Metrics: 156 tasks completed, 98% success rate, operational for 18 days (
Healthy).
- E-commerce Analyst Agent:
- Role: In-depth analytics focusing on Average Order Value (AOV), Lifetime Value (LTV), and cohort retention.
- Metrics: 243 tasks completed, 96% success rate (
Healthy).
- Growth & Ads Agent:
- Role: Monitors multi-channel marketing campaigns, ad spend efficiency, and ROAS anomalies (
Warningstatus when ROAS drops below threshold).
- Role: Monitors multi-channel marketing campaigns, ad spend efficiency, and ROAS anomalies (
- Inventory Manager Agent:
- Role: Inventory level forecasting and automated stockout prevention (
Degradedstatus when supplier API connections experience latency).
- Role: Inventory level forecasting and automated stockout prevention (
- Custom Agent Deployment Button (
+ New Agent): Enables admins to configure new specialized workers with targeted API permissions and custom prompt rules.
5.6 Tab 5: System Activity Logs & Audit Trail
Enterprise compliance and transparency require complete visibility into AI actions. The Logs tab provides a real-time audit log of every decision, query, recommendation, and API call executed by the AI suite.
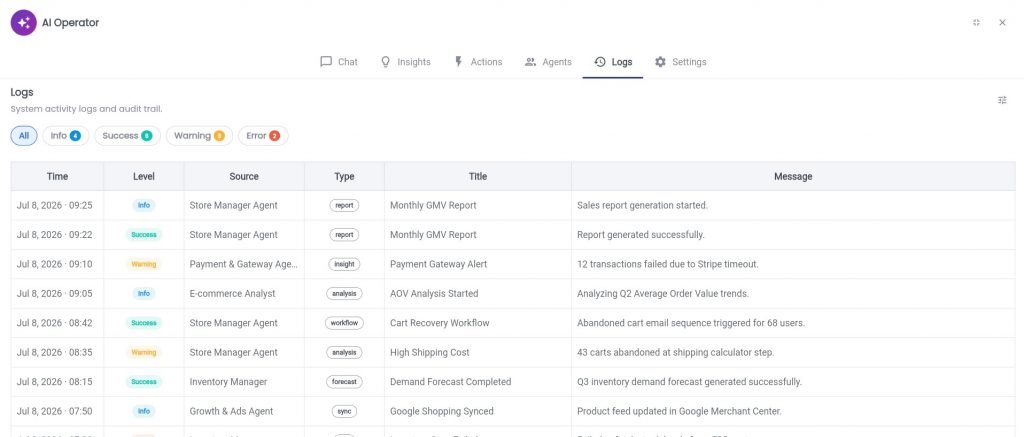
Audit Log Table Structure
- Timestamp: Exact execution time (
Jul 8, 2026). - Log Level Tags: Color-coded status badges (
Info,Success,Warning,Error). - Source Module: Identifies which agent or system component generated the entry (
Store Manager,Payment & Gateway Service,Inventory Manager,Growth & Ads). - Event Classification Type: Categorized by operational nature (
report,insight,analysis,workflow,forecast,sync,api). - Title & Message Payload: Plain-text description and payload summaries for quick debugging and administrative verification.
5.7 Tab 6: Operator Settings, Guardrails, & Memory Retention
To ensure safety, governance, and user preference alignment, the Settings tab allows administrators to configure AI behavior and guardrails.
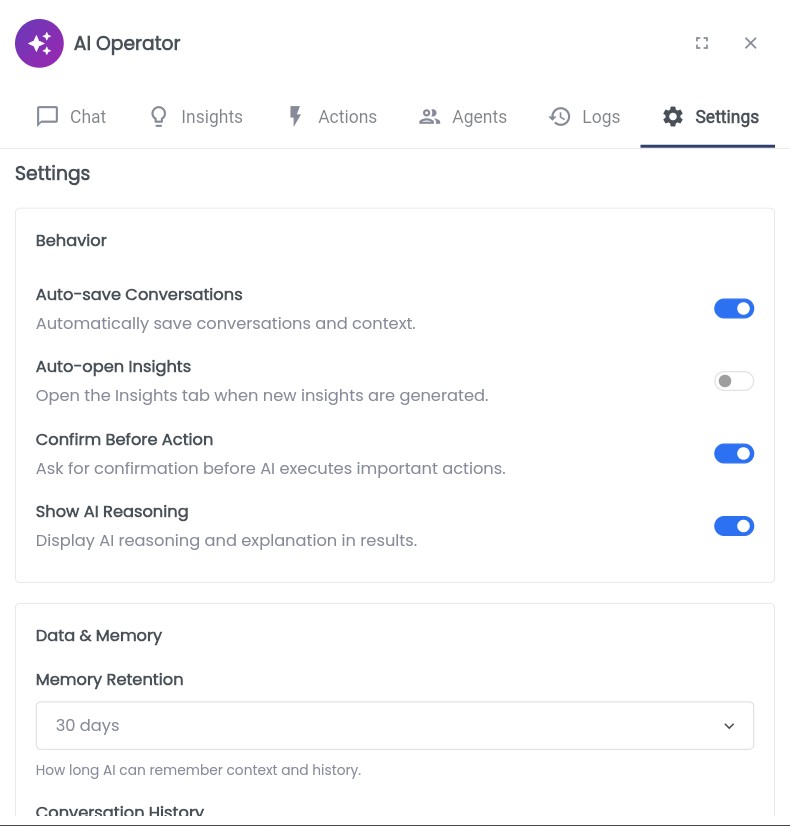
Governance & Behavioral Controls
- Behavior Configuration Toggles:
Auto-save Conversations(Enabled): Persists chat histories across sessions.Auto-open Insights(Disabled): Prevents intrusive drawer popups during deep work.Confirm Before Action(Enabled – Crucial Guardrail): Enforces a Human-in-the-loop (HITL) safeguard, requiring explicit human approval before the AI executes financial or customer-facing operations.Show AI Reasoning(Enabled): Guarantees model explainability by outputting intermediate chain-of-thought steps.
- Data & Memory Management:
Memory RetentionDropdown (30 days,60 days,90 days,Unlimited): Controls context window lifespan and privacy compliance.
6. Engineering & Architecture Considerations
Transforming an existing UI template like Ademin by FlutKit into an AI-powered application requires a modular modern technology stack:
+---------------------------------------------------------------------------------+
|                                 FRONTEND LAYER                                  |
|               Ademin Dashboard (Flutter / React / Vue UI Framework)             |
|   +--------------------------+  +-------------------+  +--------------------+   |
|   | Business Insights Cards  |  | Action Cards Widget|  | AI Operator Flyout |  |
|   +--------------------------+  +-------------------+  +--------------------+   |
+---------------------------------------+-----------------------------------------+
                                        | SSE / WebSockets / REST API
+---------------------------------------v-----------------------------------------+
|                                  BACKEND LAYER                                  |
|                       API Gateway & Orchestration Service                       |
|   +-------------------------------------------------------------------------+   |
|   | Agent Orchestrator (LangChain / LlamaIndex / AutoGen Engine)            |   |
|   +-------------------------------------------------------------------------+   |
|   | Vector Database (Pinecone / Qdrant / Weaviate) for Context Embeddings   |   |
|   +-------------------------------------------------------------------------+   |
|   | System Audit Logger & Execution Controller                              |   |
|   +-------------------------------------------------------------------------+   |
+---------------------------------------+-----------------------------------------+
                                        | Secure API Integrations
+---------------------------------------v-----------------------------------------+
|                            EXTERNAL INTEGRATIONS                                |
| [ LLM Providers (OpenAI/Anthropic) ]   [ E-commerce DB ]   [ Stripe / Payment ] |
+---------------------------------------------------------------------------------+
7. UX Best Practices for AI-Driven Dashboards
When modernizing any enterprise application with AI capabilities, adhere to these five core user experience principles:
- Always Provide Impact and Confidence Transparency: Never display an AI recommendation without telling the user why it was made and how confident the system is in its evaluation.
- Prevent Layout Shift and Cognitive Overload: Keep complex diagnostic tools organized inside expandable drawers (like the AI Operator Flyout) or maximized full-screen views rather than cluttering the core dashboard.
- Design for Asynchronous Task Management: Heavy analytical tasks take time. Provide clear visual progress bars (e.g.,
68% completed) so users know the system is actively working. - Maintain Auditable Logs: Provide clear audit trails in an explicit Logs tab to build trust with system administrators and enterprise stakeholders.
- Respect User Agency: Always allow users to toggle automated behaviors and retain manual override capabilities.
8. Conclusion & Takeaways
Upgrading a standard dashboard like Ademin by FlutKit into an AI-powered application represents a monumental leap forward in user experience. By replacing static charts with In-Context Insight Cards, static tables with Recommended Action Cards, and adding a centralized AI Operator Flyout, applications evolve from passive monitoring tools into intelligent, proactive co-pilots.